

In 1971, John Denver sang, “Sunshine on my shoulders makes me happy.” In 2022, energy companies are singing, quietly, “Sunshine on our panels makes us happy.” The environmental movement is also happy with the sun shining on solar panels as that is one step closer to lowering emissions to battle climate change.
As Research and Markets reports show, climate change has spurred a flurry of investments in renewable sources and decarbonization efforts. More than 100 countries pledged to cut methane emissions by 30.0% from 2020 levels at the recent COP26 and this is likely to have a direct impact on the energy sector, further boosting transition to other renewable sources like solar PV (photovoltaic).
Unlike wind power which requires significant investment in equipment and land, solar PV offers several advantages: low investment, low maintenance, an abundant source of power all through the year, and ease of accessibility. The result is that the United States solar energy market is expected to grow at a CAGR of 17.32% during 2022-2027, reaching solar installed capacity 270 GW by 2027 from 96.19 GW in 2020.
Solar power has become more accessible and prevalent in the United States than ever before. In the last decade alone, solar has experienced an average annual growth rate of 42%. Since the last decade, solar installations in the country have grown 30-fold. Unlike many other industries, the solar energy industry was not severely impacted by the COVID-19 pandemic, resulting in significant new installations of 19.22 GW in 2020.
Factors such as declining solar PV cost and supportive government policies are expected to drive the solar energy market in the country but supply chain vulnerability due to increasing geopolitical tensions and increasing consumption of natural gas, are expected to hinder the market’s growth during the forecast period.
The solar energy markets are maturing rapidly around the country, and solar electricity is now economically competitive with conventional energy sources in several states, including California, Hawaii, and Minnesota. The solar PV market is mainly driven by the strong federal policies like solar ITC (Investment Tax Credit), rapidly declining costs, and increasing demand across the private and public sector for clean electricity.
According to SEIA (Solar Energy Industries Assn.), in 2020, solar energy accounted for 43% of all new electricity generating capacity added to the grid. At the end of 2020, there were approximately 2.7 million residential PV systems in the United States. In 2020, the total PV installed capacity in the residential and commercial sector in the United States was 19,113.5 MW and 13,943.8 MW witnessing a rise of 20% and 12% of the residential and commercial sector compared to 2019.
In Q2 2021, the United States installed 5.7 GW (gigawatts) of solar PV capacity, enough to power 18.9 million homes. But homes are only part of the equation. in 2021, the New Jersey legislature passed a bill that will require new warehouses to be solar-ready buildings. The bill defines a warehouse as any building 100,000-sq.ft. or larger and that primarily is used to store goods for resale. Now, new warehouses built on or after July 1, 2022, will need to be optimized for solar. If the structure is intended to use hot water, then it also must allow for the installation of a solar water heating system.
According to the United States NREL (National Renewable Energy Laboratory), since 2010, there has been an 82% reduction in the cost of utility-scale PV systems in the United States. For large-scale utility project operators, lower panel costs enable them to sign PPA (Power Purchase Agreements) with consumers at a lower cost.
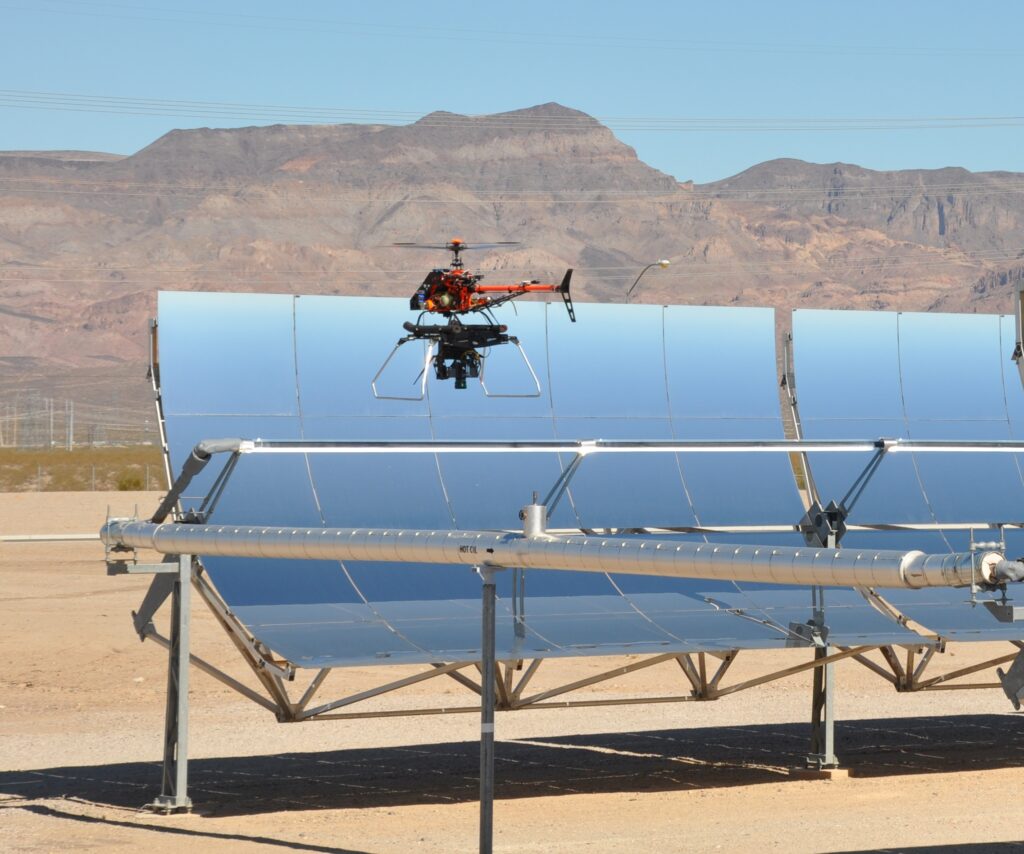
The growing movement to solar farms, utility-scale solar installations, has caused a new market to develop around inspection and maintenance, both during and after construction. The adoption of drones for reducing cost of inspection operation is a result. Asset optimization as construction of solar farms increases is expected to be the key factor driving the renewable drone market. However, legal regulations for drone operations and scarcity of skilled personnel are likely to hamper the growth of this market.
To meet the growing demand for solar farm inspection and maintenance, asset owners, inspectors, and DSPs (drone service providers) must develop a deep understanding of thermography and flight operations to take full advantage of the benefits of drone-based solar inspection. Research and Markets believes such factors will drive the growth of the solar segment in the renewable drone market.
Drones are the quickest and most efficient way to inspect a solar PV system, for example. Drones accomplish in one hour what would take manual IV curve testing a day. A drone inspection can cover anywhere between 10-50 MW in a single day.
Thermal cameras and drones allow specialized software to accurately identify anomalies. The software findings are then quality checked by a trained team to ensure that module-level anomalies are tagged with 95% accuracy, and string-level anomalies are tagged with 99% accuracy.
An example of a company addressing this aspect of solar energy development, Raptor Maps has launched several new features for its analytics and insights software platform, Raptor Solar. Raptor Maps develops custom, end-to-end machine learning and AI (artificial intelligence) solutions for enterprises that leverage drones and aerial data. The Enterprise AI solution includes custom algorithms trained for specific assets, interfaces and alerting systems, incorporation of asset and other IoT/SCADA data, backend IT integration, and more.
Their platform now comes with unlimited inspection reports that are input agnostic — drones, planes, satellites, or sensors. The platform can even digitize, standardize and store third party reports. This enables customers to compare PV module inspection results and degradation over time for a bird’s eye view of solar assets.
Raptor Solar builds digital twins of solar arrays and their software-as-a-service (SaaS) platform is intended for the entire solar lifecycle—from financing and construction through operations —and is powered by machine learning and data that Raptor Maps has gathered from over 50 GW of solar power production across 40 countries.
Users can visualize long term degradation, view recurring issues and trending anomalies as well as keep track of issue resolution. The software allows customers to quantify financial and production loss and even benchmark portfolios against their global database of PV system anomalies.
Raptor Solar also allows normalized inspection measurements with sensor and weather data across multiple inspections. It can integrate inverter, combiner, pyranometer, and other sensor data with inspection reports. Power production, irradiance and other data streams can all be imported, offering context around anomalies as well as more quantitative evidence of asset degradation.
The software integrates with SCADA (supervisory control and data acquisition system) or DAS (data acquisition system) systems with a few clicks to automate otherwise time intensive processes. This makes meeting BloombergNEF Tier 1 module OEM (original-equipment manufacturer) warranty requirements easier and faster. Using irradiance measurements, aerial thermography results are normalized to STC (standard test conditions), allowing warranty claims to be processed with less back and forth.
Additional new features include as-built field navigation and serial number geo-location. These build upon the company’s barcode scanning and serial number mapping application, the first of its kind for the solar industry. An Android or Apple mobile phone or any Bluetooth scanner allows you to scan barcodes on PV modules, validate serial numbers against OEM verified data, and store the data, geo-tagged to the as-built. The serial number scanning app lets you verify solar supply chains for safe harboring and tax incentive eligibility.
You can use the app to validate construction progress in real time or at mechanical or substantial completion. Technicians can scan serial numbers on site for location relative to anomalies. After repairs or replacement, subsequent inspections can confirm punch list completion. The mobile app can be used while on site to view data from inverters and weather stations. And the app lets users export serial number data to spreadsheets, including PV module latitudes and longitudes.
Raptor Maps is one of few companies that provide PV aerial inspections powered by machine learning that meet the standards of the Intl. Electrotechnical Commission. Raptor Maps inspections empower commercial, industrial and utility-scale solar owners and operators to take action on various types of solar equipment degradation, increasing performance and ultimately lifting ROI.
Want to tweet about this article? Use hashtags #construction #sustainability #infrastructure #IoT #AI #cloud